Data Visualization
Tourism Analytics Dashboard 2025.
A productivity monitoring application designed to track application usage, categorize activities, and visualize productivity patterns.
Project Information
Project Details
Overview
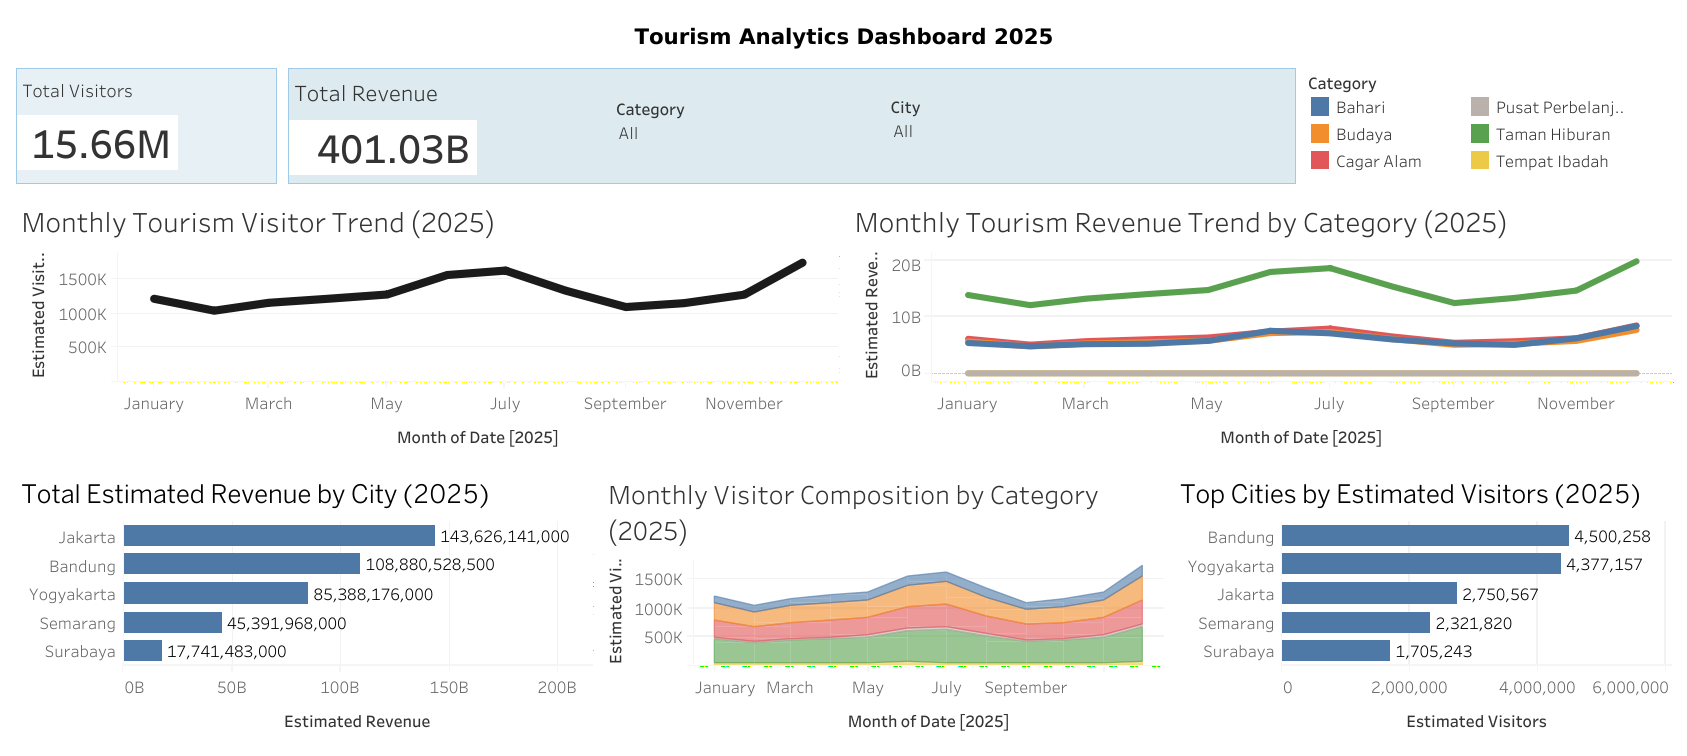
Tourism Analytics Dashboard 2025 is a group data analytics project developed using Tableau to explore tourism performance throughout 2025. The dashboard brings together visitor volume, estimated revenue, tourism categories, and city-level performance into an interactive analytical view. The dataset contains tourism information across multiple categories and cities, allowing the analysis to examine both temporal and geographic patterns.
Process
The analysis started by exploring the tourism dataset and identifying key metrics such as estimated visitors and estimated revenue. The data was then visualized through multiple perspectives: monthly visitor trends to identify seasonal patterns, monthly revenue trends to compare tourism categories, visitor composition to examine category contribution, total revenue by city to compare financial performance, and top cities by estimated visitors to identify major tourism destinations. These visualizations were integrated into an interactive Tableau dashboard with category and city filters, allowing users to explore tourism performance from different perspectives. My contribution focused on interpreting the visual results, identifying key patterns, and developing recommendations based on the analysis.
Insights
Tourism activity showed clear seasonal patterns, with visitor volume increasing during June, July, and December while February and September recorded relatively lower visitor levels.
Taman Hiburan consistently contributed the highest visitor volume and estimated revenue among the analyzed tourism categories, particularly during holiday periods.
Increases in visitor volume were accompanied by increases in tourism revenue during several peak periods, indicating a strong relationship between visitor activity and revenue.
Visitor distribution was not evenly spread across categories, with Taman Hiburan contributing the largest share while Tempat Ibadah and Pusat Perbelanjaan showed relatively lower visitor contributions.
Next
All Work ↗